


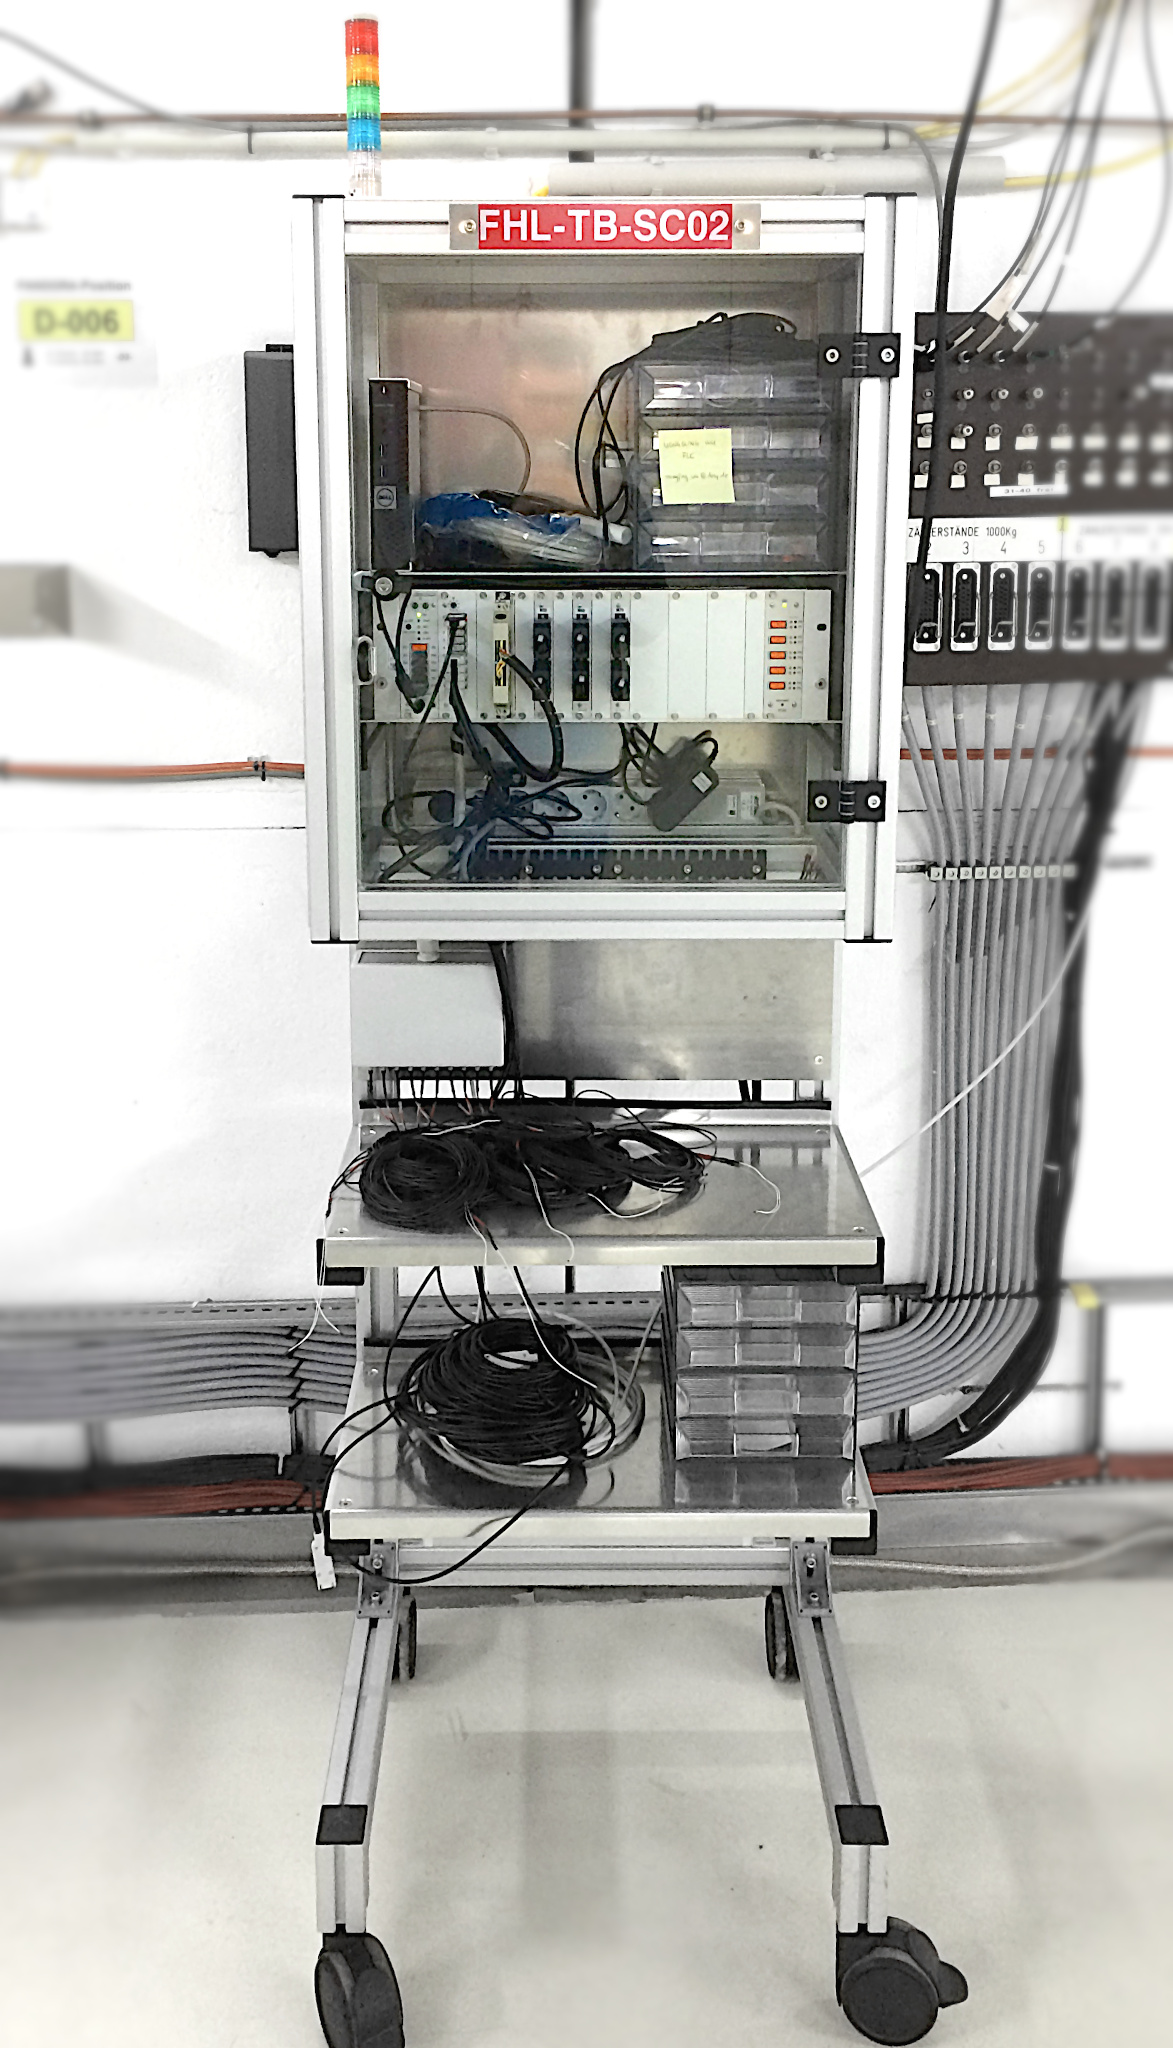
Figure 2: Slow Control System rack #02 in DESY test beam area TB24
Test Beam Weather Stations
The test beam weather stations are a setup of multiple Raspberry Pi single board computers with environmental sensors distributed over the test beam areas and the huts. The single stations deliver data on temperature and humidity. In addition, for the areas the air pressure is measured, and for the huts and the PRIMA test facility the CO2 concentration.
The data is centrally collected and made available to a Grafana web interface (only reachable in the DESY internal network), see Figure 1, and to the Tine control system at DESY. The data can be easily exported from the Grafana web frontend into a comma-separated values (CSV) file.
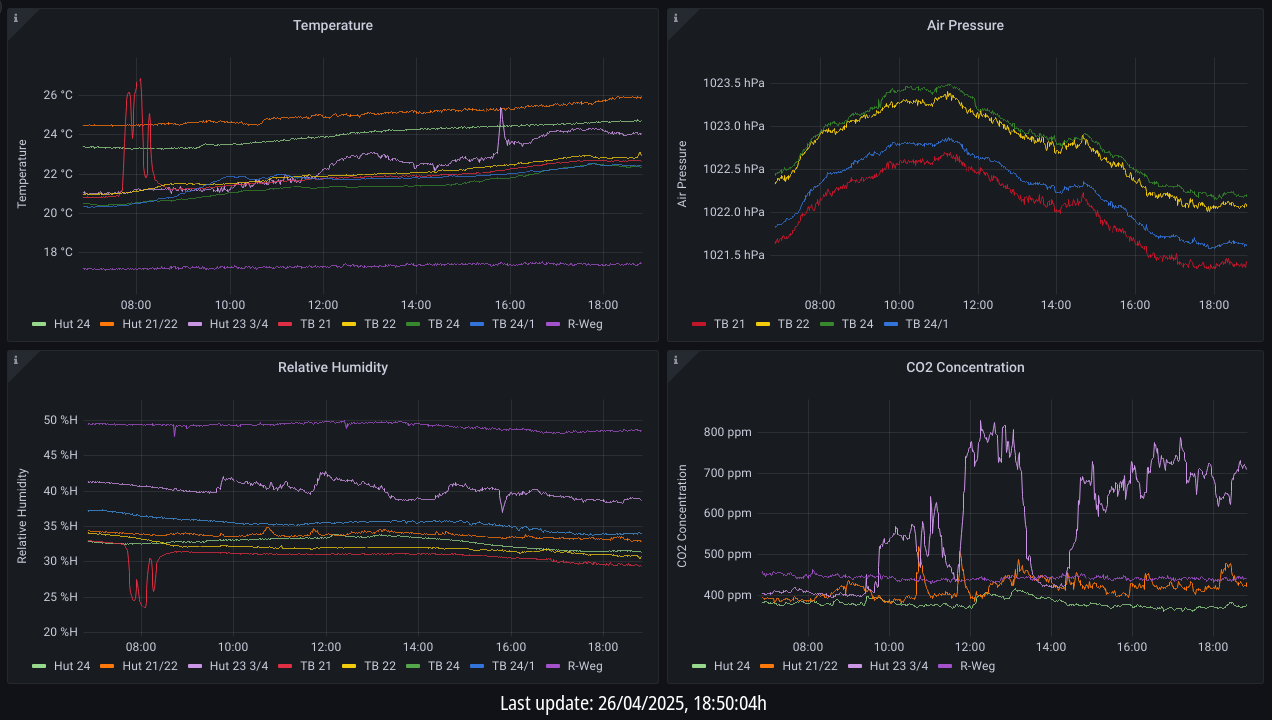
Figure 1: Screenshot of the Grafana web front-end of the test beam weather stations
(data refresh every 10 min)
 |
Grafana web interface (only reachable in the DESY internal network) |
Test Beam Slow Control System
Many complex system tests require logging the environmental parameters of the detector and the experimental area. Therefore, inside the European AIDA-2020 project, a central monitoring system has been set up with a suite of sensors and a software interface to readout the collected data.
The system is designed to be integrated into the slow control system of user groups and provides them with a ready-to-use and reliable logging system centrally maintained and supported by DESY. It was developped to be able to monitor the environmental parameters of the following three categories of the DESY II Test Beam Facility:
- Common TB parameters, such as temperature, humidity, dew point, air pressure
- TB area specific parameters, for example the dipole magnet in TB area 21
- User configurable parameters, such as the chiller temperature, nitrogen flow, etc.
The hardware consists of two portable racks, see Figure 2, that each contain:
- A Windows PC for read out and a data Logger
- LED light for warning signal
- 10 temperature sensors with 10 m cable each
- One DIGI sensor each for humidity, air pressure and dew point
- Connections for further sensors available, spare cables are on the racks
A commercial DAQ software (AMR) runs on the Windows PC in the portable rack. This is connected to the EUDAQ2 software running on a remote Linux PC for run control. Since EUDAQ is also used by all telescopes at DESY, this allows for easy integration with the test beam data stream. A converter for the EUDAQ data into the CSV format is provided. Further macros are provided for plotting of all monitored sensor channels.
| Documentation and Material |
|